Target summary view
This topic describes the Target summary view, which by default is located at the bottom of the ESPA analysis center screen.
This feature requires your account to be configured with the ESPA analysis center screen.
The Target summary view displays the information from the uploaded CDR and geo-location files. This means it is displaying the combination of data from both the CDR data and Geo-loc data tabs. The benefit of this view is that it allows you to easily group the data based on the view's column titles, allowing you to analyze the data in the manner that you want. Some of the groupings that will be of most interest to you are those that are already on the Call analyses tab, however the Target summary view has the benefit of also displaying the calls without the need for you to do any of the additional steps required when you are using the Call analyses tab. For example, to replicate the:
-
Frequent numbers analysis, group by Target number then Associate number. As you can see in the following graphic, expanding the contact number displays the calls.
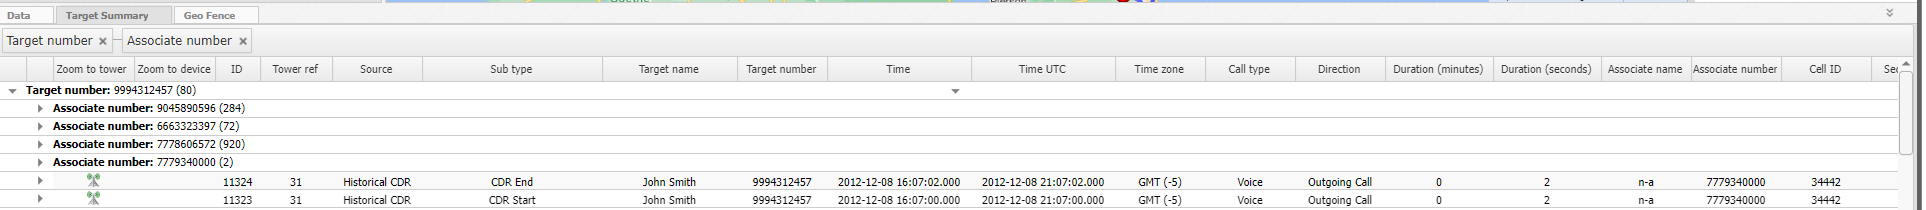
-
Sector by hour analysis, group by Sector ID then S Hour. Note, the date/time columns are all prefixed with S which represents "start". This means the data in the column always represents the start of the record. For example, a CDR record which contains a CDR Start and a CDR End record will both always have the same result in each column, even if for example the call started and ended in a different year/month/day/weekday/hour/minute range. The minute column is grouped in 10 minute intervals, for example 0 represents the time interval of 0 to 9.59 minutes, 10 represents 10 to 19.59 minutes, and 20 represents 20 to 29.59 minutes.
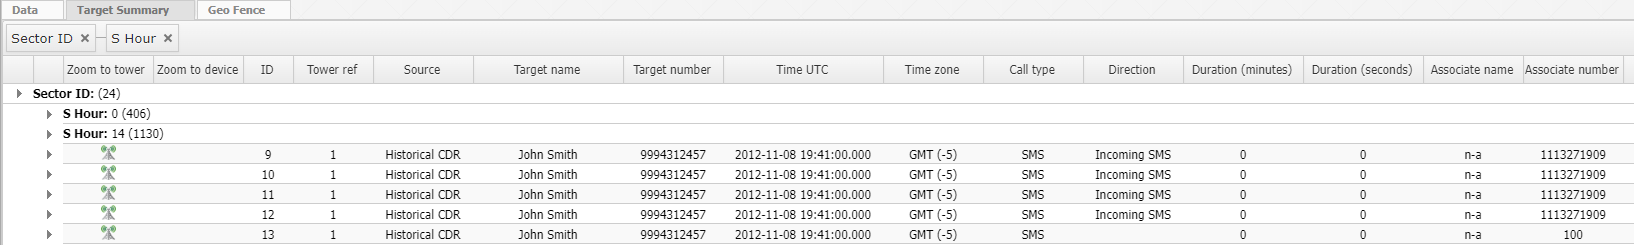
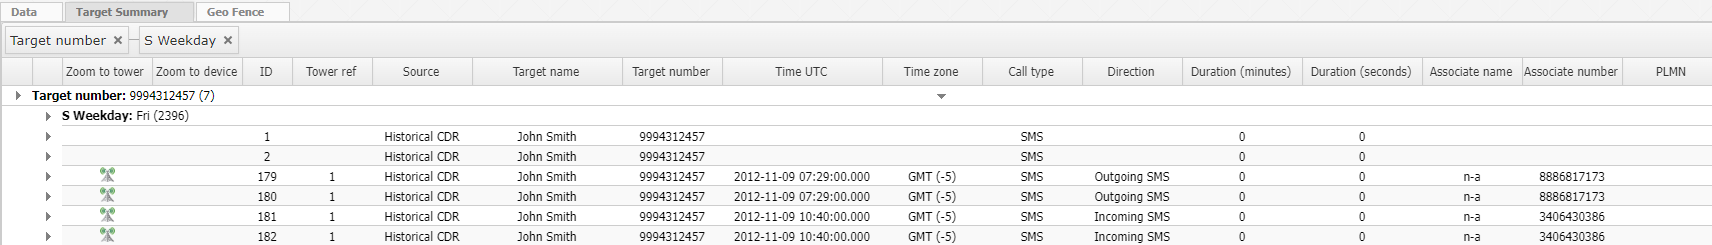
In addition to replicating the analyses on the Call analyses tab this view gives you the flexibility to group in whatever manner interests you, for example if you were interested in the target's calls by day of the week, you can group by Target number then S Weekday.
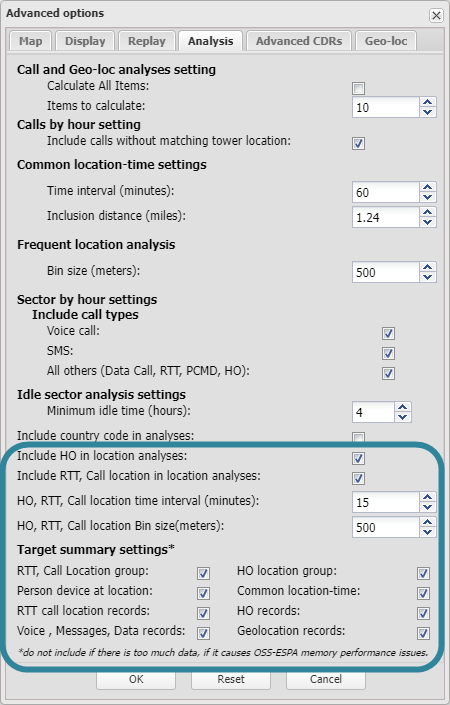
The Target summary view can display a lot of data, therefore to make it easier for you to analyze the results and improve the performance of the ESPA analysis center no data is displayed by default and you must first select which data you want displayed using the Analysis tab of the Advanced options dialog box. The settings are:

Click to open the Settings dialog box. This dialog box allows you to select which of the available columns are displayed on this view, their order, and it also allows you to rename the column title to your preferred name.
 Clear menu
The clear menu allows you to clear any filters, groupings and sortings you have applied to the view.
 Search
Click to open the search dialog for the view, which allows you to search for a value in the selected column.

Click to save the contents of the view to a csv file format.